It is said, a picture is worth a thousand words, and I have ten pictures, courtesy of NCCI’s Barry Lipton’s presentation on that subject.
It was brought to my attention by my fellow blogger, James Moore, of J&L Risk Management Consultants. I met James back in February at the NCCI 2017 Data Education Program in West Palm Beach.
Mr. Lipton is the Senior Actuary and Practice Leader, and his presentation was called, “Medical Cost Trends Then and Now.”
Yesterday’s posts regarding the slight increase in the average medical costs for lost-time claims only scratched the surface of the subject. I hope this post will dive deeper into it, so that we can see the whole picture.
In my first post from yesterday, “Slight Increase in Average Medical Costs for Lost-Time Claims, Part 1”, I discussed how physician costs and prescription drug costs impacted medical costs for lost-time claims.
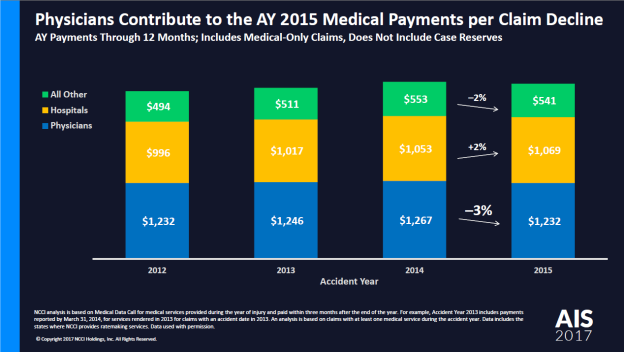
On the issue of physician costs, Mr. Lipton showed that there was a decline in the 2015 medical payments per claim due to physician costs, but as the following chart proves, despite this decline, physician costs contribute a larger share of the total costs.
Chart 1.
Source: NCCI Annual Issues Symposium 2017
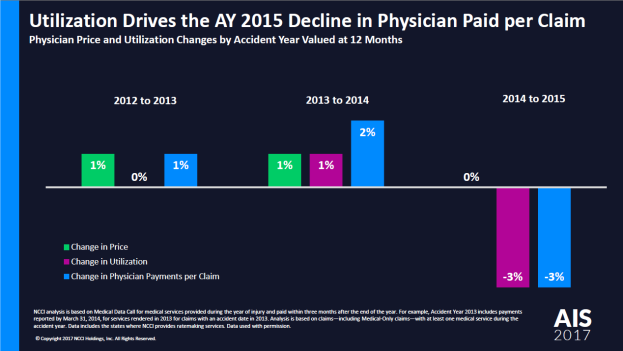
According to James, the main reason for the reduction in costs is the physician utilization per claim. Even though it is only a3% reduction, it is significant, James says, in a time of upward spiraling medical costs. Chart 2 bears this out.
Chart 2.
Source: NCCI Annual Issues Symposium 2017
The second part of my post yesterday, “Slight Increase in Average Medical Costs for Lost-Time Claims, Part 2”, looked at the steady rise of the average medical cost for lost-time claim.
If we compare the chart from yesterday’s post to the one Mr. Lipton presented, we will see that his chart does show increases and decreases over time in the average medical costs per lost-time claim, but my chart indicates that ever since 1995, it has been rising steady.
Both charts, do show that the average medical cost per lost-time claim is hovering around $30,000, and if the numbers are consistent with ones for earlier years, represents almost 60% of the total claims cost.
My Chart.
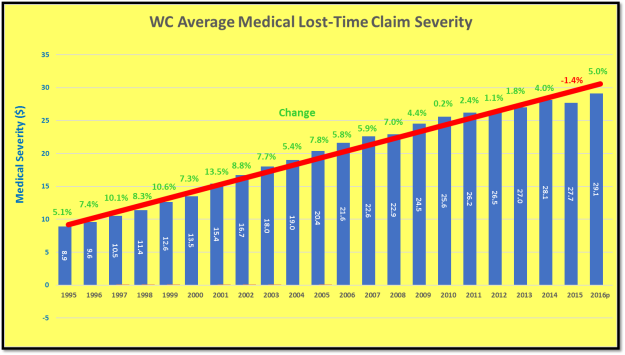
Chart 3.
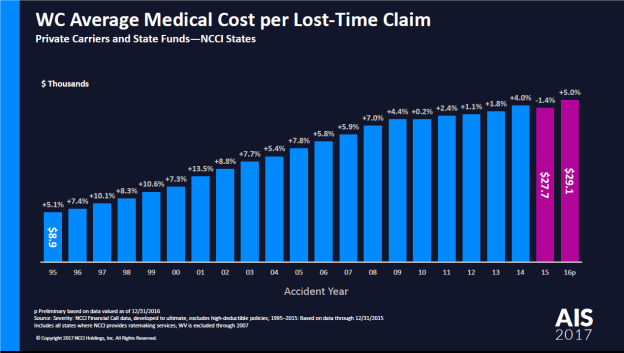
Source: NCCI Annual Issues Symposium 2017
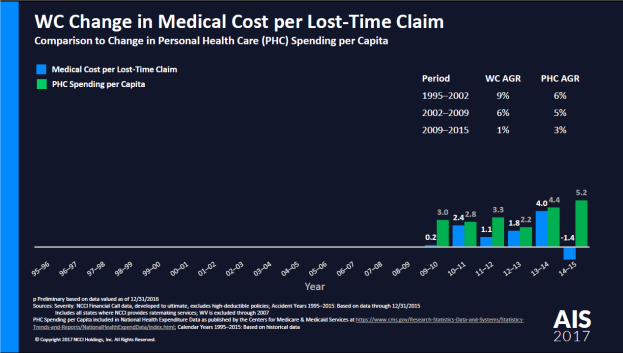
To examine this in greater detail, Mr. Lipton broke down the Accident Years into three separate periods and slides, to show the change in medical cost per lost-time claim. He compared the change in Personal Health Care (PHC) Spending per Capita with the Medical Cost per Lost-Time Claim.
In the period, 1995-2002, the average growth rate (AGR) for WC was 9%, and the AGR for PHC was 6%. In the next period, 2002-2009, WC AGR was 6%; PHC AGR was 5%, and finally, in the last period, 2009-2015, the WC AGR was 1%, while the PHC AGR was 3%, as seen in chart 4.
Chart 4.
Source: NCCI Annual Issues Symposium 2017
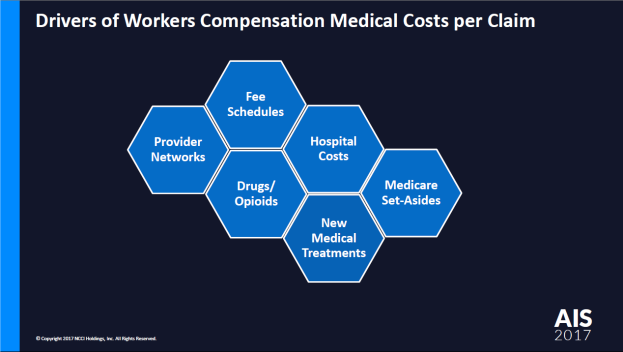
To understand what was driving the decline in Accident Year 2015, Mr. Lipton identified six different drivers, as indicated in chart 5.
Chart 5.
Source: NCCI Annual Issues Symposium 2017
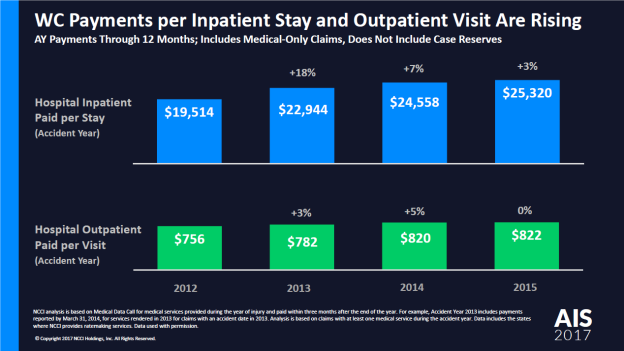
Finally, Mr. Lipton discussed how hospital costs contributed to medical cost per lost-time claims by highlighting the difference between inpatient and outpatient costs, which are rising.
The following chart looks at the four years prior to the 2016 Accident Year, 2012-2015.
Chart 6.
Source: NCCI Annual Issues Symposium 2017
In 2012, Hospital Inpatient Paid per Stay amounted to $19,514, in 2013, it rose to $22,944 (18% increase), in 2014, it was $24,558, or a 7% increase, and last, in 2015, it was $25,320, or 3% increase over the previous year.
As for Hospital Outpatient Paid per Visit, the number are considerably lower for each year when compared to Inpatient Stays, but nonetheless have been rising.
So perhaps this, at the end is why the average medical cost per lost-time claim has been rising over a period of over twenty years, from 1995 to 2015.
I wrote to James last night when I saw his recent posts on this presentation, and he responded that we are both correct in our analysis, but looking at it from different points of view.
My conclusion after reading this presentation and my discussion with James suggests to me that there are two things going on here. One, when a worker is injured and receives medical care, unless and until he or she goes to a hospital, the best way to lower costs is through what James calls one of his six keys to reducing workers’ comp costs. One of those keys is medical control by the employer, which James said reduced cost by 75%.
But I also realized that when an injured worker goes to the ER or an Ambulatory Service Center as an Outpatient, has an Inpatient stay, that this is where the medical costs go up.
Naturally, Workers’ Comp medical spending is only a fraction of the overall health care spend of the US, and as costs for health care in general rise, so too does costs in workers’ comp.
So, while many have argued or shown that they can lower costs on the front end, from time of injury to return to work for most claims where no surgery is required, one of the largest reasons for the steady rise in the average medical cost per lost-time claims is hospital costs.
On this, both James and I agree. However, it is important that many in the industry see this as well. Keep thinking that it will change by doing this or that has not worked, the numbers prove that. Maybe it is time for something out of the box.

Here’s what Joe Paduda had to say about my post. “Thoughtful post from Richard Krasner on medical cost drivers in workers’ comp. Richard’s dug into the recent NCCI analysis of medical cost categories; his take is inpatient hospital costs are a primary driver.”
LikeLiked by 1 person